Histograms in Math is one of the most difficult subjects in our school life. It contains many different concepts which can be used in different ways. Math is the first practical subject in our school life. Everyone is afraid of math in school because the questions from this subject can be too difficult or too confusing that the student does not know which concept he or she should use in the solution of the question.
Concepts in math are based on different types of practical knowledge. The concept in math can be related to any normal thing like shape or for the calculation of a certain sum of amount. In math, there is a concept of the histogram which is important for a student to learn. A student who is afraid of math should always begin with easy concepts so that he or she can build an interest in math.
What is a histogram in Math?
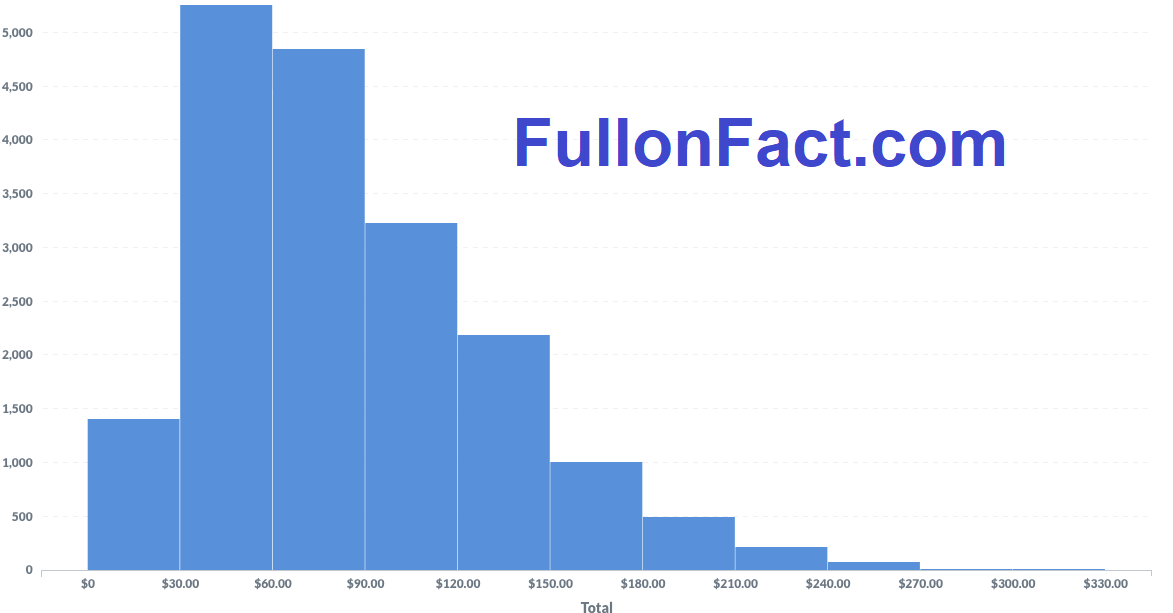
As discussed earlier histogram is an important topic in math. Before beginning to use this concept in a solution, a student must know what is the meaning of a histogram. A histogram is a statistical representation of a group of numerical data in equal width. it can be a bar chart that represents different values. The height of this bar represents how much data is present in the particular bin.
These bins can also be called classes or intervals. This concept is based on simplifying specific data in the form of this histogram. Now a student may ask that why should we build statistical data in the form of this histogram if we can just read it. The answer to this question is that it is a better way of representing and distributing a certain amount of data.
This can also clearly represent the largest and smaller values in the data. Sometimes a normal statistical data that is not represented in the histogram can be too difficult to understand because there are many values in one interval. A histogram can represent these values in the form of a chart which is ten times simpler to understand.
Frequency distribution
One of the major benefits that a histogram provides to a student is that it represents a certain value of frequency in a well-organized manner. Frequency distribution is a thing that, in some cases, can be complicated if we try to gather the data in one set. On the other hand, if these values are distributed based on a histogram, then he or she can easily watch the values and can tell which value belongs to which frequency. Frequency distributions are often known for their larger data sets.
These data sets are needed to be converted in such a way that a student should understand the values of these distributions and can continue their solution perfectly. This problem can only be solved by a histogram.
More About Histograms in Math
So it can be concluded that a histogram is a topic in math that is not only easy but can help a student in many other concepts which have a collection of data. Cuemath is a platform which tells more important things about histograms to the students which can be helpful in the process of making a histogram chart. Students love this concept of math as these are very easy to make.
Histograms are a good way of representing particular data in your assignments. Histogram plays a major role if a person is building a presentation on a certain topic. This concept of the histogram is too important for the further life of a student because this concept is almost used in every stream. this thing is necessary for a student who wants to pursue his or her further career in any field.
Things like the bar chart or a pie chart play a big role in representing difficult data into an easier one. This makes the concept of histogram too important for our further life.
Corel Draw X8 with Crack Kickass
